The FiveThirtyEight news organization publishes on a daily basis investigations based on data. The organization is perhaps best known for it’s consolidation of political polling results, but there are many, many other investigation topics as well.
One way to scan relatively quickly through the available data is via their GitHub site. Don’t be put off by the techie-sounding name. Direct your browser to this address.
The page looks like this:
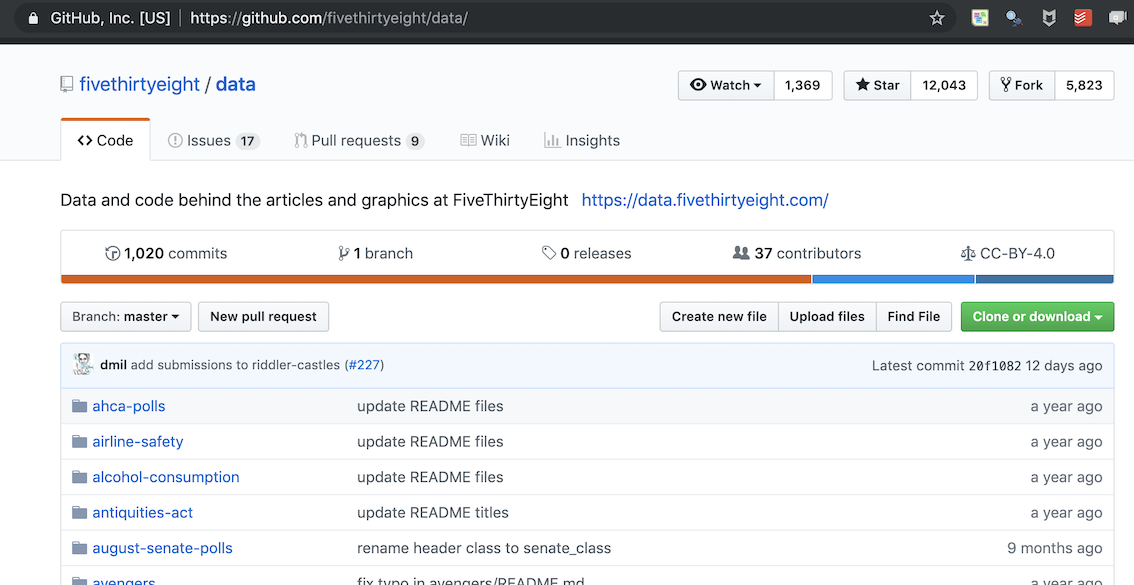
Each of the file-icon names, for instance, ahca-polls, points to a directory that usually contains a short description, a link to the FiveThirtyEight news story relating to the data, and one or more CSV-format data files.
To illustrate, let’s look at the religion-survey-results directory.
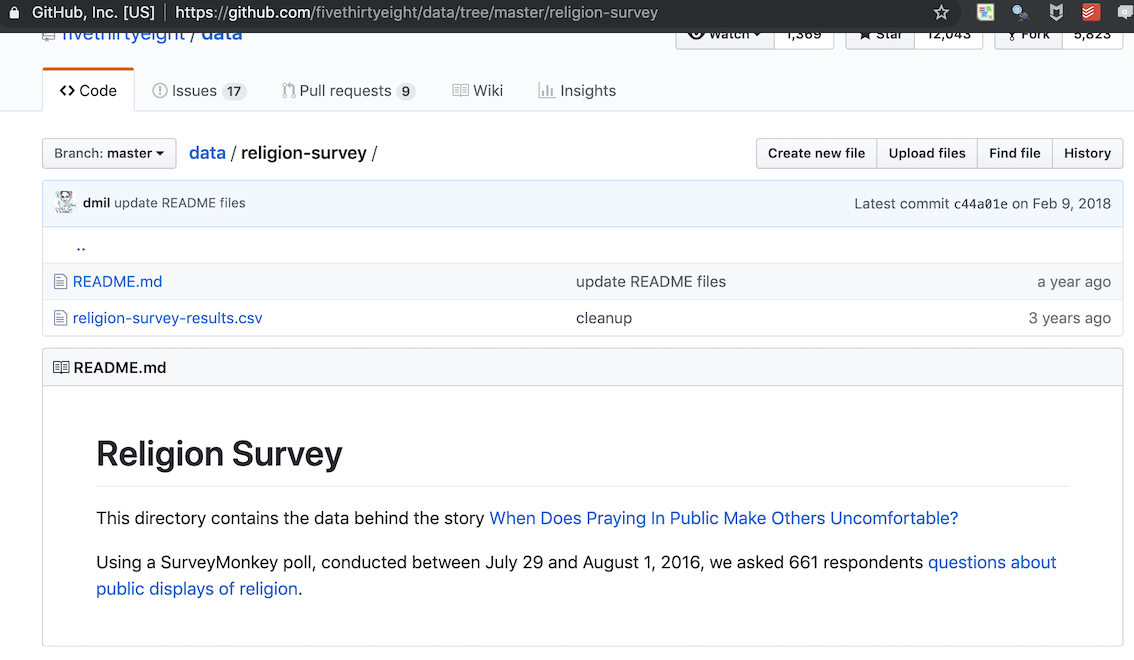
Follow the link to the CSV file and you’ll be presented with the data in text form, which you can copy and paste to your own file.
You can access the file directly from within R. Click on the “Raw” button to go to a new page, and copy its URL. In this case that’s:
file_url <- "https://raw.githubusercontent.com/fivethirtyeight/data/master/religion-survey/religion-survey-results.csv"
Survey <- readr::read_csv(file_url)
# If in RStudio interactively, the following command will let you see the data
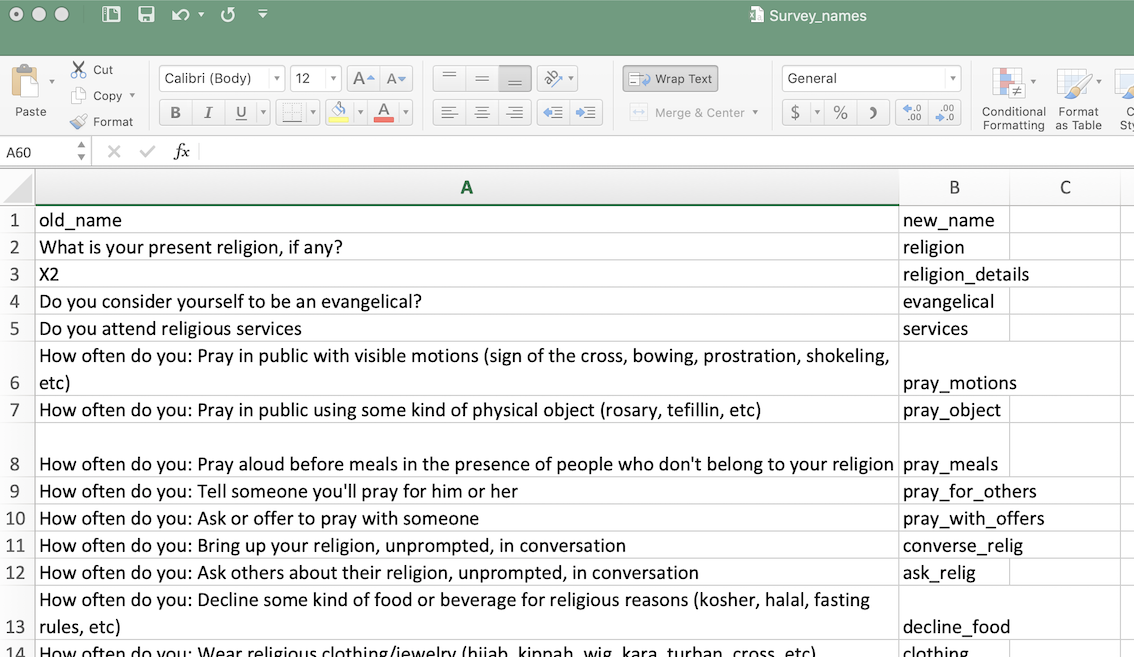
# View(Survey) The names of variables in data collected by systems such as SurveyMonkey or Google Forms can be very verbose. You will want to change them to something more concise. Here’s a good way to do that.
Vnames <- tibble::data_frame(old_name = names(Survey), new_name = "")
readr::write_csv(Vnames, path = "~/Downloads/Survey_names.csv")
This will create a CSV file which you can open with whatever spreadsheet program or editor you prefer. (The name of the file, "Survey_names.csv" can be replaced with whatever you like, but keep the .csv ending.)
When editing the spreadsheet, fill in the new_name column with appropriate (short) variable names. It’s reasonable, for data sets with large numbers of variables, to name them with a sequence like V1, V2, V3, and so on, that can be automatically generated by the spreadsheet program. In any event, make sure all the new names are unique and valid as R names.
Once you’ve finished editing, save the file. Then read it back in to R and assign the names to the data frame:
Vnames <- readr::read_csv("~/Downloads/Survey_names.csv")
names(Survey) <- Vnames$new_name
save(Survey, file = "~/Downloads/Survey.rda")
Very often, the work is just starting here, since you may have to recode variables to make them easy to work with. There may be other elements of data cleaning needed as well. For instance, in this data set the first row is bogus, filled with "response" as the entry for all variables.
Survey <- Survey[-1,] # Delete the first rowLooking at a graphic of variables can help identify where there are problems …
library(ggformula)
gf_jitter(pray_motions ~ age | religion, data = Survey, width = 0.3, height = 0.3)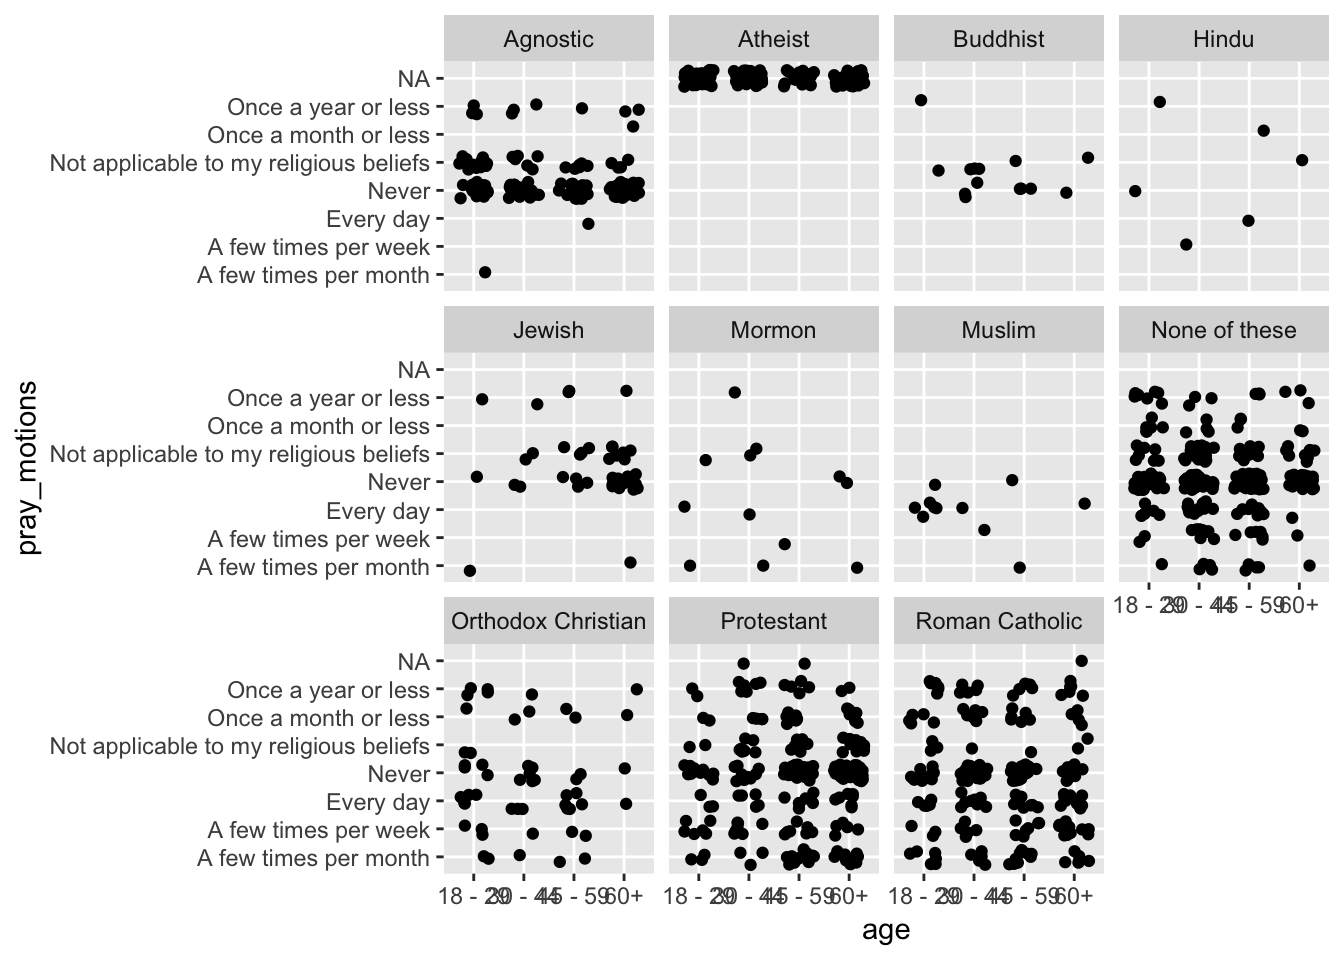
Notice that the levels of the pray_motions variable do not plot out in a sensible order. You would want to recode these. Doing such cleaning requires some suitable tool. It can be done in R, but some mastery of writing R scripts is required.