GAISE 2016
- Teach statistical thinking.
- Teach statistics as an investigative process of problem-solving and decision- making.
- Give students experience with multivariable thinking.
Focus on conceptual understanding.
Integrate real data with a context and purpose.
Foster active learning.
Use technology to explore concepts and analyze data.
Use assessments to improve and evaluate student learning.
Real data
The StatPREP definition:
- 1000-ish rows, 4+-ish variables
- captured in the wild: not collected for teaching statistics
For the moment, put aside the important matters of context and purpose.
Instead, focus on the organization of data in a way that will contribute to
- good habits in the workplace
- ability to use technology effectively
- multivariable thinking
Discipline in presenting data encourages good work habits.
Data organization
- Almost all StatPREP participants say they teach little or nothing about organizing data.
- In textbooks, teaching about data focusses on variable types, not organization.
- Organizing data properly is critically important to …
- using real data with technology
- providing modern views of data
- structuring data collection effectively
- Encourage/expose students to “data-base thinking”
- ironically, this is a very mathematical form of thinking, but few mathematicians know about it. SQL is the algebra that gets you a job! Or, for people who don’t like a “vocational” emphasis: Data base thinking empowers you to explore and present both simple and complex data!
Unruly data
unruly: (adj.) disorderly and disruptive and not amenable to discipline or control
Rules tame unruliness
- Always in a spreadsheet fail ✔︎✔︎✔︎
- Always column-wise fail
- Always column names fail
- Always codebook fail
- Any subset of rows is a valid data set.
- no summaries in data︎
- no other info, e.g. codebook, in spreadsheet fail
- Segregate data collection and data analysis
- never change your data as part of the analysis
Implications: You need to have a way to distribute such data.
- Google spreadsheets, google forms
CSV files
More efficient forms
Basic operations
Fundamental
- summarize / reduce
- in spreadsheet, add a new row: forbidden in tidy data
- in
mosaic, use specific function, e.g.df_stats()
- mutate / transform,
- in spreadsheet, add a new column
- not in
mosaic
- group – handle summarize and mutate in a groupwise way
- in spreadsheet pivot table
- in
mosaic, use variables to right of tilde, e.g. blood_pressure ~ age + sex
- filter
- in spreadsheet, “hide” data
- not in
mosaic
Superficial
- arrange
- in spreadsheet, “sort”. But how do you do this without altering the data
- not in
mosaic
- select
- in spreadsheet, how do you do this without altering the data?
- not in
mosaic
Profound
- join
- in spreadsheet “fusion tables” but will be phased out in Dec. 2019 in terms of SQL operations
- spread/gather
- in spreadsheet pivot/unpivot
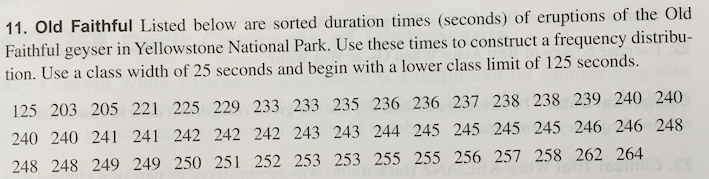
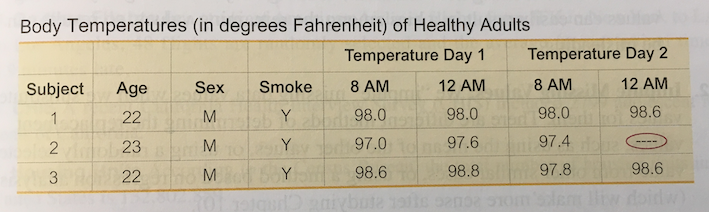
Quiz
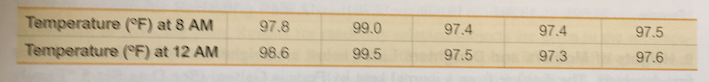
List the many ways in which this “table” violates the conventions for effective data organization.
Variable types
These are often introduced as definitions before the student has any use for them.
In stats book:
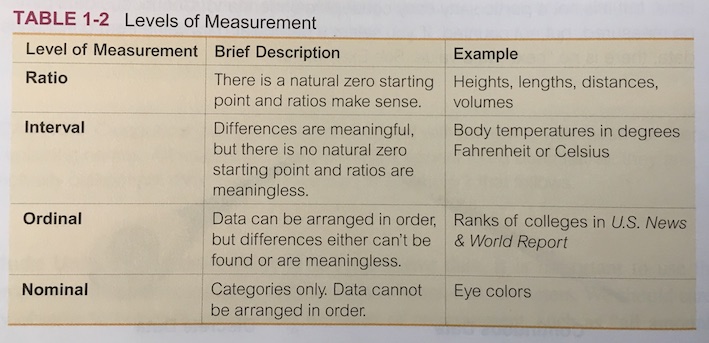
- numerical: interval, ratio, count, measure, …
- cagegorical: unordered, ordered
Variable types in actual use:
- numerical:
- natural numbers vs codes
- counts: natural numbers
codes: a representation of discrete levels: better to use actual labels
- quantities (with dimension and units) –it’s worthwhile to be able to distinquish these special types
- arbitrary origin (e.g. °F or °C) vs meaningful origin independent of the units, e.g. counts, growth rates - in graphics, make sure zero is on the axis!
- times and dates
- natural numbers vs codes
- categorical: fixed vs “random”
- Fixed: an easily enumerable set of distinct possibilities b Random: anything else where there are no limits applied, e.g. free text, names of people
Reduction variables
What operations make sense:
- sum (not for numerical codes, dates)
- is sum meaningful? e.g. miles per gallon versus gallons per mile
- mean (not for numerical codes)
Transformation variables
- ratio (only with natural origin): but how often are we doing ratio transformations in stats class?
- difference ()
- sqrt, log, … (only with natural origin)