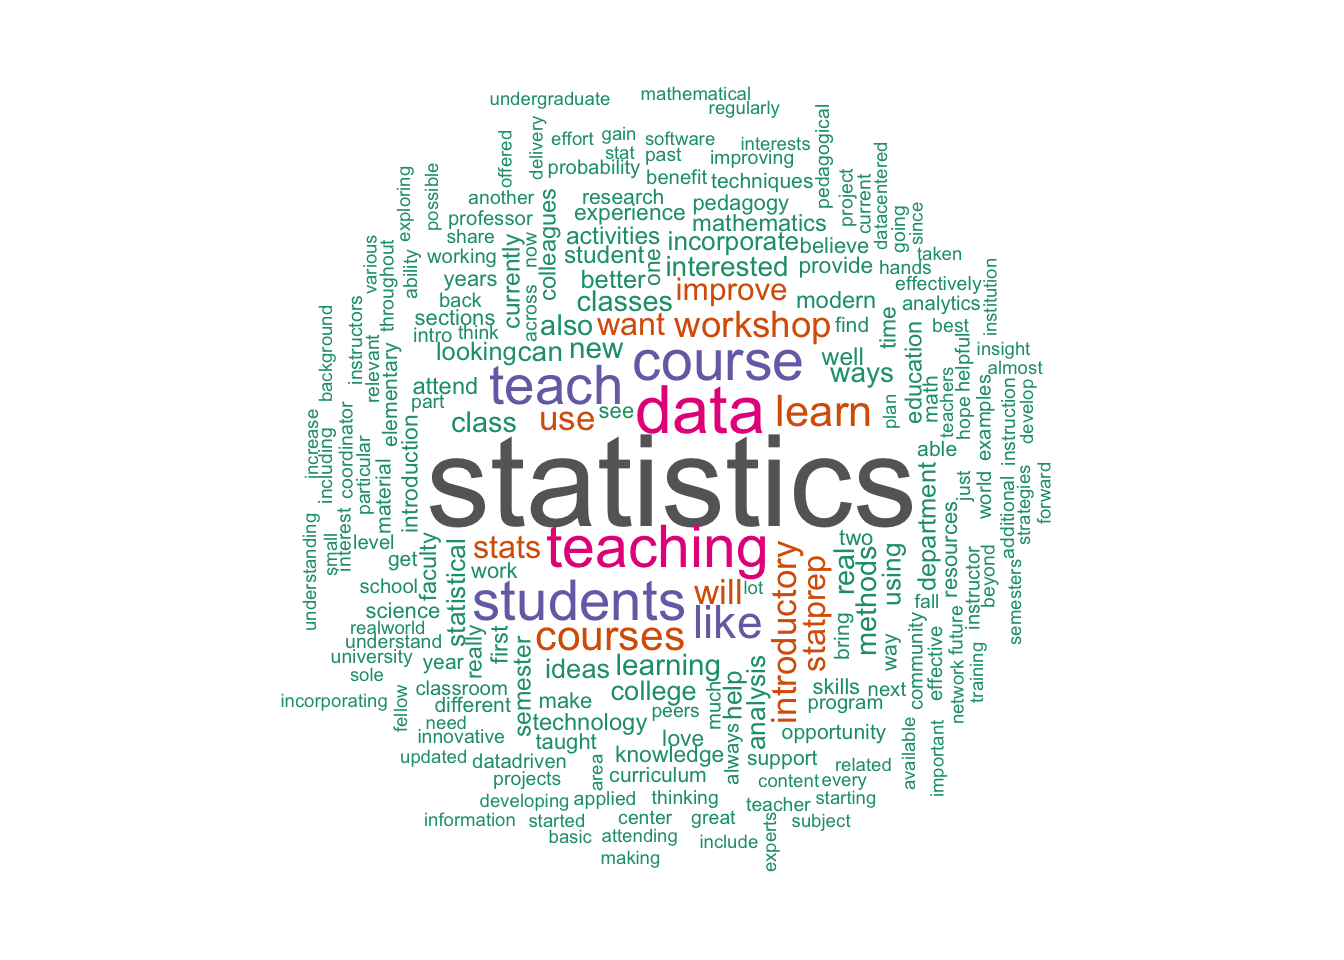
What are you looking for?
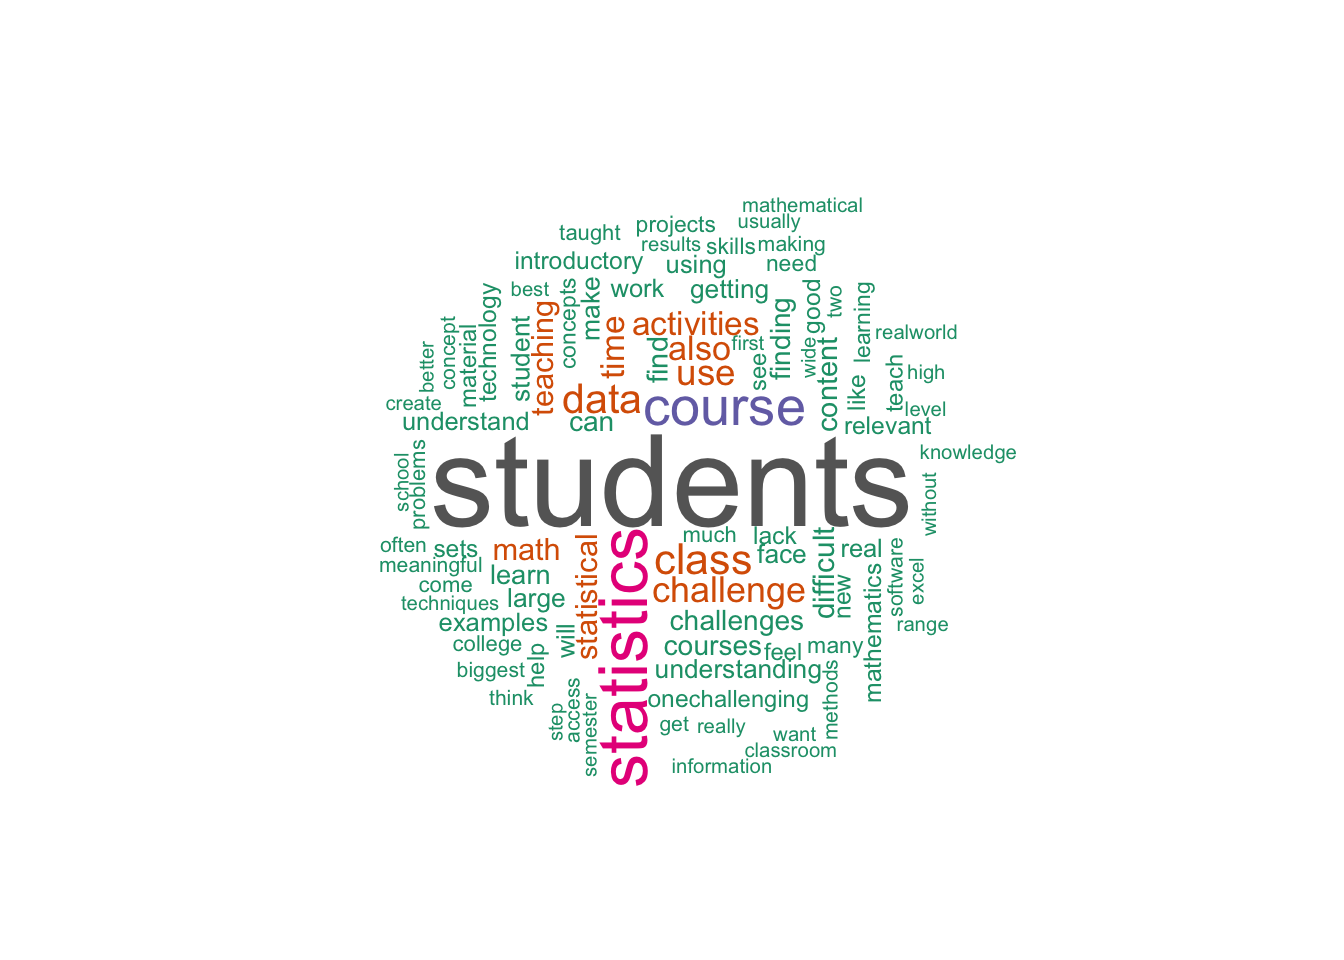
What challenges do you face?
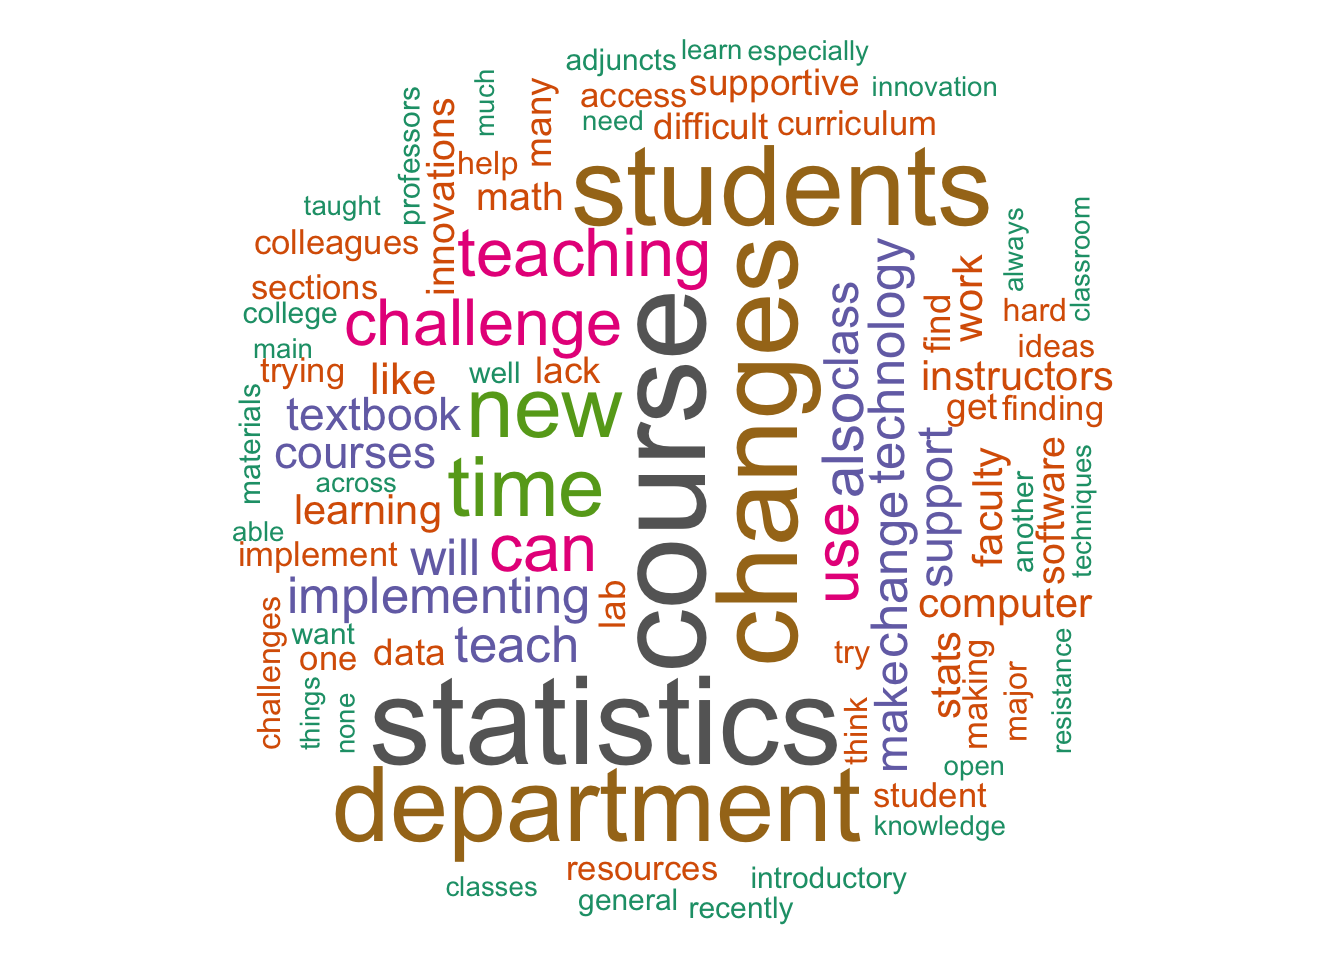
What are institutional challenges
Background and experience
From the pre-workshop survey
- Institution type
- 8 / 19 Two-year college
- 12 / 19 Four year institution
- Grad-school discipline
- 18 / 19 Mathematics (and maybe it’s 19 / 19)
- 2 / 19 Computer science
- 2 / 19 Engineering
- Statistics experience
- 3 / 19 studied applied statistics in grad school
- 2 / 18 studied theoretical statistics in grad school
- 7 / 18 do applied statistics outside of teaching
- Teaching experience: number with > 2 years experience
- 15 / 16 “other” mathematics (1 has no experience)
- 14 / 19 calculus (1 has no experience)
- 10 / 19 college algebra (4 have no experienceª)
- 7 / 19 intro stat
- 3 / 16 computer science (12 have no experience)
- 3 / 18 statistics (7 have no experience)
✽ Might these be 4-year instructors at institutions without a college algebra course?
How teaching calculus might distort a view of statistics
Example of calculus-like problem … of a sort that I very rarely see in statistical work.
The scores on the SAT verbal test in recent years follow approximately the N(517, 112) distribution.
- What is the proportion of students scoring under 400?
- What is the proportion of students scoring between 400 and 550?
- How high must a student score to place in the top 10% of all students taking the SAT? State answer as a whole number.
- Using the empirical rule, what is the probability that a randomly [selected] SAT test will have a verbal score between 629 and 853?
Your priorities
- Top priority
- 8 / 14 learn how to incorporate real data into classes (17 / 19) YES*
- 7 / 14 learn about tools/technology (18 / 19) YES*
- 7 / 14 learn new statistics teaching methods (18 / 19) YES*
- 7 / 14 learn how to engage students (15 / 19) WE PLAN and HOPE*
- 6 / 14 learning more about data science concepts (17 / 19) YES*
- 6 / 14 learning to use R (14 / 19) IF YOU WANT*
- 5 / 14 get ideas about modifying department curriculum (11 / 19) WE THINK SO*
All together, the 14 respondents have 58 “top” priorities!
✽ Will we cover this in the next two days?
Confidence
Only 4 / 19 were confident in developing data models.
Possible issues:
- what does “developing” mean?
- what does “models” mean?
- and, maybe, what does “data” mean?
Software vs by hand
- 1 / 19 – by hand
- 9 / 19 – by software
- 9 / 19 – by hand and also by software
- Nobody – by graphing calculator
Statistical theory
- 3 / 19 – algebra is the best method to express statistics, yet …
- 10 / 18 – statistical concepts are intrinsically based in algebraic notation
- 5 / 19 – include theoretical probability distributions
- EVERYONE – The many methods covered in introductory statistics can be reduced to a small set of common principles.
- What are those principles? Write them down here
Computing
- 16 / 19 Computing offers a framework for understanding statistical theory that is as legitimate as the theory based on probability rules and algebra.
- but, earlier, 10 / 18 said “statistical concepts are intrinsically based in algebraic notation”
- 18 / 19 Proficiency in using computers to handle and manage data should be an important goal of a statistics course.
- Why aren’t you using preferred software?
- 9 / 15 I haven’t had time to explore software / technology beyond what I’m currently using.
- 4 / 15 Takes too much time for students to learn software / technology
- Expense or Department or Access: at most 1 or 2 out of 15
- What do you use for software?
- 9 / 14 Spreadsheets
- 5 / 14 Graphing calculator
- 4 / 14 Other
- 3 / 14 Web apps
- 2 / 14 R/RStudio
- 1 / 14 Minitab/SPSS
- 0 / 14 SAS/JMP
- What would you like to use for software?
- 7 / 11 R/RStudio
- 6 / 11 Spreadsheets
- 4 / 11 SAS/JMP
Graphics
This was the strongest consensus …
Indicate the method of computing that you believe helps students learn introductory statistics best.
- 17 / 18 – Graphics routinely drawn using statistical software
Question: Do you teach them the algorithms and programming steps for producing graphics or just have them go at it with the appropriate software function?
Success
Out of 90 possible answers:
- 4 / 90 are very successful
- 36 / 90 are successful
- 51 / 90 are moderately successful
- 10 / 90 not successful
Grade: B- overall
Limits to change
- 10 / 15 Limited personal time
- 11 / 15 Student characteristics (e.g., ability, interest, etc.)
- Others (institutional constraints, transferability, no access to computing) got at most 3/15 each
Three components of the workshop
- Things you can directly use in teaching:
- Exploring data-driven activities via Little Apps
- We’ve got about 20 activities on a variety of topics in statistics.
- Faculty development: Statistics topics the textbook doesn’t cover
- Bootstrapping
- Unifying inference with regression
- Faculty development: Data science
- Sources of data, graphing data
- R ecosystem
Levels will range from the easy to the aspirational.